Shoreline Apartments - Sold Prices - Market Trends
Market Trends and Sold Prices at Shoreline
Author: Gareth Davies - Award Winning Broker and Property Consultant
The Shoreline community has become a predominantly owner-occupier / end-user market rather than an investor-buyer market. This is a positive because it creates stability in the community and the property market
There has been a decrease in the volume of sales during 2025. However, this is not because of a lack of demand from buyers. Most of the potential buyers want apartments that are vacant on transfer of ownership it is the shortage of vacant apartments that is contributing to the decrease in the number of sales.
The average Asking Price / Listing Price compared to the average Sold Price
Earlier this year, the gap between owner’s expectations and what buyers were prepared to offer (AED/sq.ft) was getting closer. However, in the past four months the difference between the average sold price compared to the average listing / asking prices is now 86%.
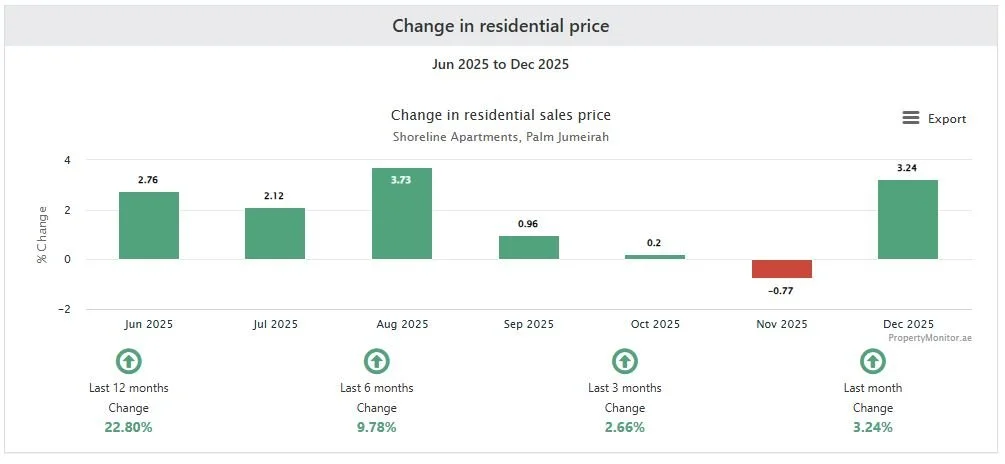
Sold Price Growth (AED/sq.ft).
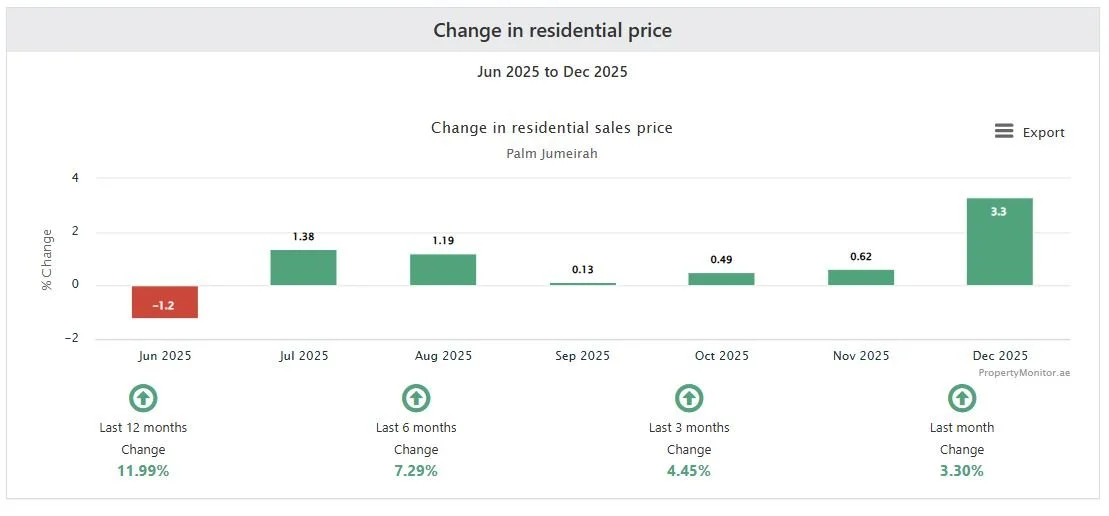
The sale price growth at Shoreline has out-performed the average price for the Palm Jumeirah communities.
Sale Price Growth (AED/sq.ft) past 12 months.
Shoreline 22.8%
Palm Jumeirah 11.9%Sale Price Growth (AED/sq.ft) past 6 months.
Shoreline 9.78%
Palm Jumeirah 7.29%Sold prices have increased by nearly 23% during the past 12 months. However, an increasing proportion of the Shoreline apartments have been upgraded/refurbished and therefore the average price per square foot in the community increases.
Data Source: Property Monitor
Data source: Property Monitor
Sold Prices at Transfer
Park Side J-Type. 1-Bedroom.
| Type & Location | Building | Beds | Price (AED) | Sq.Ft | AED / Sq.Ft | Date |
|---|---|---|---|---|---|---|
| Type J - Park Side | Jash Hamad | 1 | 1,970,000 | 716 | 2,751 | 28 Oct 2025 |
B Type. 1-Bedroom. Park Side.
| Type & Location | Building | Beds | Price (AED) | Sq.Ft | AED / Sq.Ft | Date |
|---|---|---|---|---|---|---|
| Type B - Park Side | Al Hallawi | 1 | 2,815,000 | 1,145 | 2,459 | 21 Jan 2026 |
| Type B - Park Side | Abu Keibal | 1 | 2,675,000 | 1,144 | 2,338 | 14 Nov 2025 |
| Type B - Park Side | Al Shahla | 1 | 2,750,000 | 1,144 | 2,404 | 04 Nov 2025 |
| Type B - Park Side | Al Hamri | 1 | 2,635,000 | 1,145 | 2,301 | 15 Oct 2025 |
| Type B - Park Side | Al Shahla | 1 | 2,650,000 | 1,144 | 2,316 | 13 Oct 2025 |
| Type B - Park Side | Al Tamr | 1 | 2,800,000 | 1,145 | 2,445 | 17 Nov 2025 |
B Type. 1-Bedroom. Beach Side.
| Type & Location | Building | Beds | Price (AED) | Sq.Ft | AED / Sq.Ft | Date |
|---|---|---|---|---|---|---|
| Type B - Beach Side | Al Hatmi | 1 | 3,850,000 | 1,144 | 3,365 | 07 Jan 2026 |
| Type B - Beach Side | Al Haseer | 1 | 4,150,000 | 1,140 | 3,640 | 11 Dec 2025 |
| Type B - Beach Side | Al Nabat | 1 | 3,500,000 | 1,136 | 3,081 | 13 Oct 2025 |
| Type B - Beach Side | Al Basri | 1 | 3,500,000 | 1,144 | 3,059 | 14 Aug 2025 |
| Type B - Beach Side | Al Basri | 1 | 3,700,000 | 1,144 | 3,234 | 11 Aug 2025 |
| Type B - Beach Side | Al Khudrawi | 1 | 3,800,000 | 1,144 | 3,322 | 11 Aug 2025 |
D Type. 2-Bedrooms. Park Side.
| Type & Location | Building | Beds | Price (AED) | Sq.Ft | AED / Sq.Ft | Date |
|---|---|---|---|---|---|---|
| Type D - Park Side | Al Hallawi | 2 | 4,100,000 | 1,550 | 2,645 | 21 Jan 2026 |
| Type D - Park Side | Al Khushkar | 2 | 3,900,000 | 1,550 | 2,516 | 23 Dec 2025 |
| Type D - Park Side | Al Hallawi | 2 | 4,125,000 | 1,550 | 2,661 | 10 Dec 2025 |
| Type D - Park Side | Al Tamr | 2 | 3,800,000 | 1,550 | 2,452 | 04 Dec 2025 |
| Type D - Park Side | Al Shahla | 2 | 3,890,000 | 1,550 | 2,510 | 08 Oct 2025 |
| Type D - Park Side | Al Anbara | 2 | 4,500,000 | 1,550 | 2,903 | 12 Sep 2025 |
| Type D - Park Side | Al Shahla | 2 | 3,800,000 | 1,550 | 2,452 | 27 Aug 2025 |
| Type D - Park Side | Al Habool | 2 | 3,990,000 | 1,550 | 2,574 | 19 Aug 2025 |
D Type. 2-Bedrooms. Beach Side.
| Type & Location | Building | Beds | Price (AED) | Sq.Ft | AED / Sq.Ft | Date |
|---|---|---|---|---|---|---|
| Type D - Beach Side | Al Dabas | 2 | 5,785,000 | 1,550 | 3,732 | 07 Jan 2026 |
| Type D - Beach Side | Al Msalli | 2 | 6,450,000 | 1,550 | 4,161 | 19 Dec 2025 |
| Type D - Beach Side | Al Khudrawi | 2 | 5,725,000 | 1,550 | 3,694 | 16 Dec 2025 |
| Type D - Beach Side | Al Dabas | 2 | 5,900,000 | 1,550 | 3,806 | 10 Sep 2025 |
| Type D - Beach Side | Al Basri | 2 | 5,800,000 | 1,550 | 3,742 | 26 Aug 2025 |
| Type D - Beach Side | Al Basri | 2 | 6,500,000 | 1,550 | 4,194 | 12 Aug 2025 |
| Type D - Beach Side | Al Msalli | 2 | 6,875,000 | 1,550 | 4,435 | 07 Aug 2025 |
E-Type. 2-Bedrooms. Park Side.
| Type & Location | Building | Beds | Price (AED) | Sq.Ft | AED / Sq.Ft | Date |
|---|---|---|---|---|---|---|
| Type E - Park Side | Al Khushkar | 2 | 3,290,908 | 1,589 | 2,071 | 09 Sep 2025 |
| Type E - Park Side | Jash Hamad | 2 | 3,600,000 | 1,579 | 2,280 | 19 Jan 2026 |
| Type E - Park Side | Abu Keibal | 2 | 3,825,000 | 1,588 | 2,409 | 15 Jan 2026 |
| Type E - Park Side | Al Anbara | 2 | 4,900,000 | 1,584 | 3,093 | 23 Dec 2025 |
| Type E - Park Side | Al Anbara | 2 | 3,582,000 | 1,582 | 2,264 | 13 Oct 2025 |
| Type E - Park Side | Al Anbara | 2 | 3,700,000 | 1,582 | 2,339 | 03 Oct 2025 |
| Type E - Park Side | Al Tamr | 2 | 3,600,000 | 1,582 | 2,276 | 09 Sep 2025 |
| Type E - Park Side | Al Tamr | 2 | 3,300,000 | 1,586 | 2,081 | 08 Sep 2025 |
| Type E - Park Side | Al Habool | 2 | 3,700,000 | 1,611 | 2,297 | 02 Sep 2025 |
E-Type. 2-Bedrooms. Beach Side.
| Type & Location | Building | Beds | Price (AED) | Sq.Ft | AED / Sq.Ft | Date |
|---|---|---|---|---|---|---|
| Type E - Beach Side | Al Msalli | 2 | 4,400,000 | 1,586 | 2,774 | 21 Oct 2025 |
| Type E - Beach Side | Jash Falqa | 2 | 3,950,000 | 1,563 | 2,527 | 16 Sep 2025 |
F-Type. 2-Bedrooms. Park Side.
| Type & Location | Building | Beds | Price (AED) | Sq.Ft | AED / Sq.Ft | Date |
|---|---|---|---|---|---|---|
| Type F - Park Side | Al Khushkar | 2 | 5,300,000 | 1,996 | 2,655 | 06 Jan 2026 |
| Type F - Park Side | Al Hamri | 2 | 4,600,000 | 1,997 | 2,303 | 30 Dec 2025 |
| Type F - Park Side | Jash Hamad | 2 | 4,450,000 | 1,991 | 2,235 | 11 Nov 2025 |
| Type F - Park Side | Al Hallawi | 2 | 4,400,000 | 2,014 | 2,185 | 29 Oct 2025 |
| Type F - Park Side | Al Sarrood | 2 | 4,980,000 | 1,993 | 2,499 | 23 Oct 2025 |
| Type F - Park Side | Al Habool | 2 | 4,000,000 | 1,550 | 2,581 | 30 Sep 2025 |
| Type F - Park Side | Jash Hamad | 2 | 5,100,000 | 1,991 | 2,562 | 19 Aug 2025 |
| Type F - Park Side | Al Sarrood | 2 | 4,650,000 | 1,997 | 2,328 | 14 Aug 2025 |
F-Type. 2-Bedrooms. Beach Side.
| Type & Location | Building | Beds | Price (AED) | Sq.Ft | AED / Sq.Ft | Date |
|---|---|---|---|---|---|---|
| Type F - Beach Side | Al Msalli | 2 | 7,150,000 | 1,993 | 3,588 | 30 Jan 2026 |
| Type F - Beach Side | Al Sultana | 2 | 6,384,407 | 1,993 | 3,203 | 29 Dec 2025 |
| Type F - Beach Side | Al Nabat | 2 | 7,500,000 | 1,994 | 3,761 | 12 Dec 2025 |
| Type F - Beach Side | Al Sultana | 2 | 7,750,000 | 1,974 | 3,926 | 11 Dec 2025 |
| Type F - Beach Side | Al Haseer | 2 | 6,900,000 | 1,994 | 3,460 | 03 Dec 2025 |
| Type F - Beach Side | Al Nabat | 2 | 6,500,000 | 1,997 | 3,255 | 10 Nov 2025 |
| Type F - Beach Side | Al Haseer | 2 | 6,200,000 | 2,011 | 3,083 | 17 Oct 2025 |
| Type F - Beach Side | Al Sultana | 2 | 6,850,000 | 1,974 | 3,470 | 22 Sep 2025 |
A-Type. 3 Bedrooms. Park Side.
| Type & Location | Building | Beds | Price (AED) | Sq.Ft | AED / Sq.Ft | Date |
|---|---|---|---|---|---|---|
| Type A - Park Side | Jash Hamad | 3 | 5,400,000 | 2,162 | 2,498 | 31 Jan 2026 |
| Type A - Park Side | Al Hallawi | 3 | 5,500,000 | 2,160 | 2,546 | 27 Jan 2026 |
| Type A - Park Side | Al Tamr | 3 | 4,999,000 | 2,160 | 2,314 | 14 Jan 2026 |
| Type A - Park Side | Al Tamr | 3 | 5,300,000 | 2,160 | 2,454 | 22 Dec 2025 |
| Type A - Park Side | Al Sarrood | 3 | 4,999,999 | 2,160 | 2,315 | 09 Dec 2025 |
| Type A - Park Side | Al Shahla | 3 | 5,000,000 | 2,156 | 2,319 | 27 Nov 2025 |
| Type A - Park Side | Al Shahla | 3 | 4,410,076 | 2,241 | 1,968 | 20 Nov 2025 |
| Type A - Park Side | Jash Hamad | 3 | 5,900,000 | 2,162 | 2,729 | 12 Nov 2025 |
| Type A - Park Side | Abu Keibal | 3 | 5,000,000 | 2,156 | 2,319 | 01 Sep 2025 |
| Type A - Park Side | Al Khushkar | 3 | 4,999,999 | 2,156 | 2,319 | 15 Aug 2025 |
A-Type. 3-Bedrooms. Beach Side.
| Type & Location | Building | Beds | Price (AED) | Sq.Ft | AED / Sq.Ft | Date |
|---|---|---|---|---|---|---|
| Type A - Beach Side | Al Sultana | 3 | 6,250,000 | 2,158 | 2,896 | 12 Dec 2025 |
| Type A - Beach Side | Al Dabas | 3 | 5,900,000 | 2,139 | 2,758 | 08 Dec 2025 |
| Type A - Beach Side | Jash Falqa | 3 | 6,600,000 | 2,158 | 3,058 | 25 Nov 2025 |
| Type A - Beach Side | Al Msalli | 3 | 6,150,000 | 2,141 | 2,872 | 04 Nov 2025 |
| Type A - Beach Side | Al Nabat | 2 | 4,125,000 | 1,550 | 2,661 | 22 Oct 2025 |
| Type A - Beach Side | Al Haseer | 3 | 5,401,425 | 2,152 | 2,510 | 15 Sep 2025 |
| Type A - Beach Side | Al Sultana | 3 | 5,900,000 | 2,158 | 2,734 | 08 Sep 2025 |
| Type A - Beach Side | Al Hatmi | 3 | 6,300,000 | 2,158 | 2,919 | 26 Aug 2025 |
| Type A - Beach Side | Al Msalli | 3 | 6,400,000 | 2,233 | 2,866 | 05 Aug 2025 |
C-Type. 3-Bedrooms. Park Side.
| Type & Location | Building | Beds | Price (AED) | Sq.Ft | AED / Sq.Ft | Date |
|---|---|---|---|---|---|---|
| Type C - Park Side | Al Tamr | 3 | 4,999,000 | 2,181 | 2,292 | 26 Nov 2025 |
| Type C - Park Side | Al Hamri | 3 | 5,800,000 | 2,221 | 2,611 | 20 Nov 2025 |
| Type C - Park Side | Al Anbara | 3 | 4,700,000 | 2,181 | 2,155 | 25 Sep 2025 |
| Type C - Park Side | Al Shahla | 3 | 4,475,000 | 2,222 | 2,014 | 04 Sep 2025 |
C-Type. 3-Bedrooms. Beach Side.
| Type & Location | Building | Beds | Price (AED) | Sq.Ft | AED / Sq.Ft | Date |
|---|---|---|---|---|---|---|
| Type C - Beach Side | Al Hatmi | 3 | 5,900,000 | 2,212 | 2,667 | 14 Jan 2026 |
| Type C - Beach Side | Al Khudrawi | 3 | 4,400,000 | 2,181 | 2,017 | 06 Jan 2026 |
| Type C - Beach Side | Al Sultana | 3 | 5,500,000 | 2,212 | 2,486 | 29 Dec 2025 |
| Type C - Beach Side | Al Nabat | 3 | 5,400,000 | 2,222 | 2,430 | 03 Dec 2025 |
| Type C - Beach Side | Al Msalli | 3 | 4,900,000 | 2,200 | 2,227 | 27 Nov 2025 |
| Type C - Beach Side | Al Dabas | 3 | 5,100,000 | 2,181 | 2,338 | 31 Oct 2025 |
| Type C - Beach Side | Al Sultana | 3 | 4,999,999 | 2,212 | 2,260 | 09 Oct 2025 |
| Type C - Beach Side | Al Msalli | 3 | 5,200,000 | 2,181 | 2,384 | 17 Sep 2025 |
Penthouses -Park Side
| Type & Location | Building | Beds | Price (AED) | Sq.Ft | AED / Sq.Ft | Date |
|---|---|---|---|---|---|---|
| Type H - Park Side | Abu Keibal | 4 | 10,000,000 | 5,266 | 1,899 | 22 Aug 2025 |
| Type H - Park Side | Al Hallawi | 4 | 10,000,000 | 5,237 | 1,909 | 17 Nov 2025 |
| Type H - Park Side | Al Hamri | 4 | 9,750,000 | 5,237 | 1,862 | 18 Sep 2025 |
Penthouses -Beach Side
| Type & Location | Building | Beds | Price (AED) | Sq.Ft | AED / Sq.Ft | Date |
|---|---|---|---|---|---|---|
| Type G - Beach Side | Al Dabas | 4 | 13,500,000 | 4,838 | 2,790 | 26 Jan 2026 |
| Type G - Beach Side | Al Haseer | 4 | 10,687,729 | 4,837 | 2,210 | 04 Oct 2025 |
To know more about the current market, the selling & renting figure of your properties, please contact us via the form below or click the WhatsApp logo.
Ready to Find Your Dream Property in Dubai?
Get Expert Guidance & Personalized Investment Advice
Connect with me directly on WhatsApp for: